Help Collins Leeds Method Tool
Overview
The Collins Leeds Method (CLM) Tool is a tool used to cluster your matches together by their relations to each other.
Using your FTDNA, 23andMe and My Heritage data, you can create a grid that will show you how your matches match each other. Other companies are coming soon.
Basic Options:
The options screen looks something like this.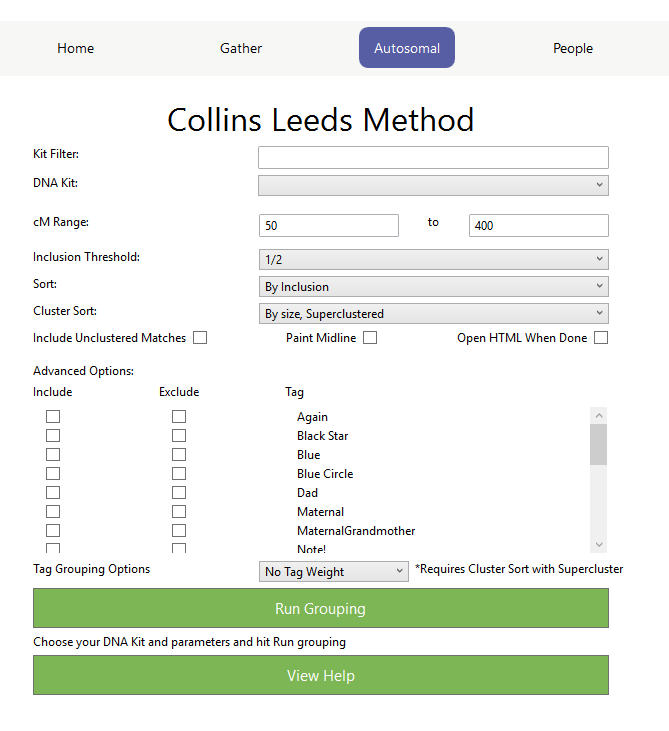
If the Advanced Options are missing, you are either not logged in to the Client with a Genetic.Family account, or you have not enabled the Genetic.Family Bridge under the Options page within the client.
Kit Filter
Typing in to this field will limit the DNA Kit dropdown to only those kits that have a name containing that input.
For example, to find all kits for John Collins, you may type the full name or just "John"
DNA Kit
You can select any kit that you have gathered for FTDNA, MyHeritage, 23andMe, or GEDMatch.
In addition, you may also select the option to choose a Generic or FTDNA Match/ICW File combination.
Match File/ICW File
These fields only appear if you have selected the Generic or FTDNA Match/ICW File option under DNA Kit
If you select an approriate Match and ICW file for the selected testing company, you can use this in place of a kit from the database. This has a few advantages:
- You can modify the Match or ICW files to eliminate unwanted matches. Note: You only need to remove it from one file or the other to be excluded (but both is fine, too)
- You can save your Match and ICW files before doing a gather, to get a "snapshot" of your current data to be able to run again in the future to compare against the latest results.
cM Range
Enter this value to set a limit for the Match's Total cM to the kit selected in the DNA Kit option.
The default value is 50 to 400 cM but try moving it up or down to target matches in certain relationship ranges.
Different ranges will yield different results for different kits, so running it for various ranges may offer more insight.
Inclusion Threshold
This threshold is the minimum percentage of people within a cluster a person has to match to be included.
By default, it's 1/2, meaning everybody in the cluster matches at least half of the other people. Try setting it to 2/3 to get more but tighter clusters.
Sort
The way matches within each cluster
- By Inclusion - those who match the most others within the cluster will be in the upper-left corner.
- By cM - those who match the primary kit by the highest cM will be in the upper-left corner.
The default is By Inclusion. Try switching to By cM to be able to see those who match the primary kit the most be sorted near each other.
Cluster Sort
The order in which the clusters appear in the chart
- By Size - The clusters will appear from largest to smallest
- By cM - The clusters will appear in order of the maximum cM match to the primary kit.
- By Size, Superclustered - By Size, but as each cluster is placed, others that have a significant amount of cross-cluster matches will appear near it. Superclusers are bordered with a lighter border than full Clusters.
- By cM, Superclustered - By cM, but as each cluster is placed, others that have a significant amount of cross-cluster matches will appear near it. Superclusers are bordered with a lighter border than full Clusters.
Include Unclustered Matches
If selected, Unclustered matches that do not fit into any cluster will paint. This can be helpful, because the cross-cluster matches are still drawn, so you can see partial relations.
Try it out with one of the Superclustered options under Cluster Sort to see where they fall on the chart.
Paint Midline
If selected, self-matches will be painted black both in the Excel and HTML pages.
This can be helpful when reordering clusters in Excel to make sure you get the whole cluster.
Open HTML When Done
Advanced Options
These options require a Genetic.Family account and the local web service be started under the DNAGedcom Client Settings Page.
Include/Exclude Tags
If you choose to Include Tags, only the matches which have been Tagged will appear in the list.
If you do not select any Tags, then nothing will be excluded. If you pick all tags, those that have not been tagged at all will not appear, so be careful when choosing your tags.
If you choose to Exclude Tags, then matches which have the selected tags will be excluded from the match, even if they are in the Included tags section.
Tag Grouping Options
Selecting one of these options will modify how Clusters or Superclusters are built.
- Weight Tags Closer - This will adjust the weight a match has when determining inclusion. For example, if a Cluster has 9 people, a Match who matches 4 within it would be exluded under 1/2 inclusion. However, if some of those 4 are tagged with the same tag as the Match, it could be included.
- Force Tags Clustering - When building a Cluster, this will force in any single Match that matches someone within that cluster and shares a tag.
- Supercluster Tags - When building Superclusters, Clusters that share common tags will be weighted closer together, in addition to the usual cross-cluster comparison. Those who match tags and have some cross-clusters will be even more likely.
CLM Output
The primary output of the CLM is an HTML file, with an Excel file also generated in the same folder.
The HTML File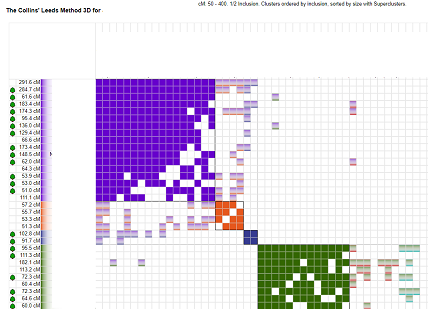
Viewing your clusters
This is where you will find your clusters, in HTML format! They are drawn with a dark black border around each cluster and a gray border around each Supercluster. Mousing over any filled square will show the name of the two people involved.
A shaded gray box indicates a Cross-Cluster Match, which is a match between two people in different clusters. You will notice that each is gray, and shaded with the two colors of the associated Clusters. This allows you to see which clusters have relationships between them at a glance.
For each row, you will also have the following information:
- A link to the tree, if available. Private trees have a red line drawn through them.
- The total Shared cM between the match and the kit being analyzed
- The Match's name - If available, clicking the name will open the Match page in a new tab.
Genetic.Family Integration
If the DNAGedcom Client is runnning and the Genetic.Family Bridge is enabled, you can then view details for the clusters, and add tags.
You can also filter your CLM match list by tags.
For more information about tagging, see CLM Tagging
If you click on a cluster and choose View Cluster, the members of that cluster are shown. 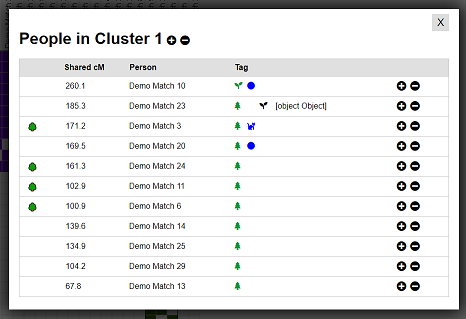
From here, you can:
- Tag people or clusters
-
View the following info for each person:
- 🌳 - a link to the Match's Tree
- Shared cM
- Name (This is a link to the match itself)
- A list of tags
- Tag Add/Remove buttons
The Excel File
The Chart Tab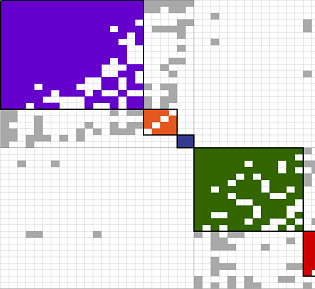
This is where you will find your clusters, in Excel format! They are drawn with a dark black border around each cluster and a gray border around each Supercluster. A gray box indicates a match between two people not within the same cluster, indicating at least a partial link between clusters.
Some important items to note:
- The colors of the clusters are arbitrary! They were chosen to give a distinct list of 10 colors you can talk about. They repeat after the 10, so even if they are the same color, they don't belong in the same cluster if they don't touch!
- The clusters don't mean they are the only members of that one line. This is a guideline to create research and pursue new angles
- The Cross-Cluster Matches can have just as much signifcance as the clusters themselves. Treat them as clues for how the clusters are related.
Here is a helpful Blog post from Dana Leeds on how to use the Excel file to label and organize your results.
The Data Tab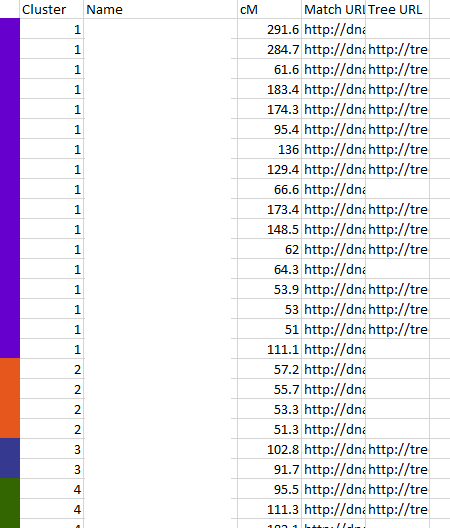
This houses the raw data for the matches.
Here you can view the following fields:
- Cluster
- Name
- cM (in relation to the kit being analyzed)
- A link to the Match Page, if available
- A link to the Match's Tree page, if available